
If you sell online, you're spending real money across Meta, Google, TikTok, and maybe CTV or YouTube. The uncomfortable part: every platform claims credit for the same sales, and none will tell you which spend grew the business versus which took credit for orders you'd have won anyway.
No single tool can answer that, because each has a blind spot the others don't. A fancier dashboard won't fix that. A stack of three methods can: causal measurement to estimate real impact, post-purchase surveys to catch what tracking misses, and multi-touch attribution to run the day to day.
Why can't one tool measure your ad spend?
Every method has a blind spot, and no platform will tell you where its own is. Attribution assigns credit to the paths it can see, which isn't the same as measuring what caused the sale. Privacy hides whole channels. Surveys depend on memory. Each is useful, and each has predictable failure modes.
Most stores run on last-click, or the numbers each ad platform reports about itself. That tells you which touchpoint got the final click, not whether that ad spend caused the sale.
A channel that closes buyers who were already going to convert looks like a hero. A channel that created the demand in the first place looks like dead weight. Cut the wrong one, and you kill growth you couldn't see.
This isn't just a hunch. Gordon and colleagues compared observational methods against 15 randomized advertising experiments at Facebook and found the observational estimates overstated ad effects by roughly three times in half the studies. It doesn't mean every attribution tool is "3x wrong," but it does mean rich behavioral data alone can fail to recover what advertising actually caused.
The word underneath all of this is incrementality: the extra sales an ad actually caused, over and above what you'd have sold anyway. That "would have happened anyway" baseline is the whole game, and a click can't see it.
Then there's privacy. Consent prompts, app tracking rules, walled gardens, and cross-device journeys all sit between what influenced a buyer and what your ad tracking can observe. Third-party cookies still work in Chrome, so this is signal loss, not a clean death, but the effect on your reporting is the same: a partial, biased view you're treating as the truth.
What is a measurement stack?
A measurement stack uses three layers, each with a different job. Causal measurement estimates the real impact of your ad spend. Post-purchase surveys catch the channels tracking can't see. Multi-touch attribution gives you fast daily reporting on trackable paths. The point isn't to average three answers until you get one you like. It's to know which method gets the final word on which question.
Causal measurement comes in a few forms, and they aren't interchangeable. A holdout experiment keeps one group from seeing a channel and compares it against a matched group that did. The difference is the lift the channel caused, and an experiment is the only method here that identifies that lift by design. Media mix modeling (MMM) works top-down, estimating each channel's contribution from your spend and sales over time under a set of assumptions. It covers the whole mix and is far more strongly calibrated to experiments than trusted alone. Always-on incrementality runs holdouts continuously, so the causal read is steady instead of quarterly.
A causal test gives you an estimate and a range, not a certainty. A 2.4x incremental ROAS with a tight range can carry a budget decision; the same number spanning near zero to 6x can't.
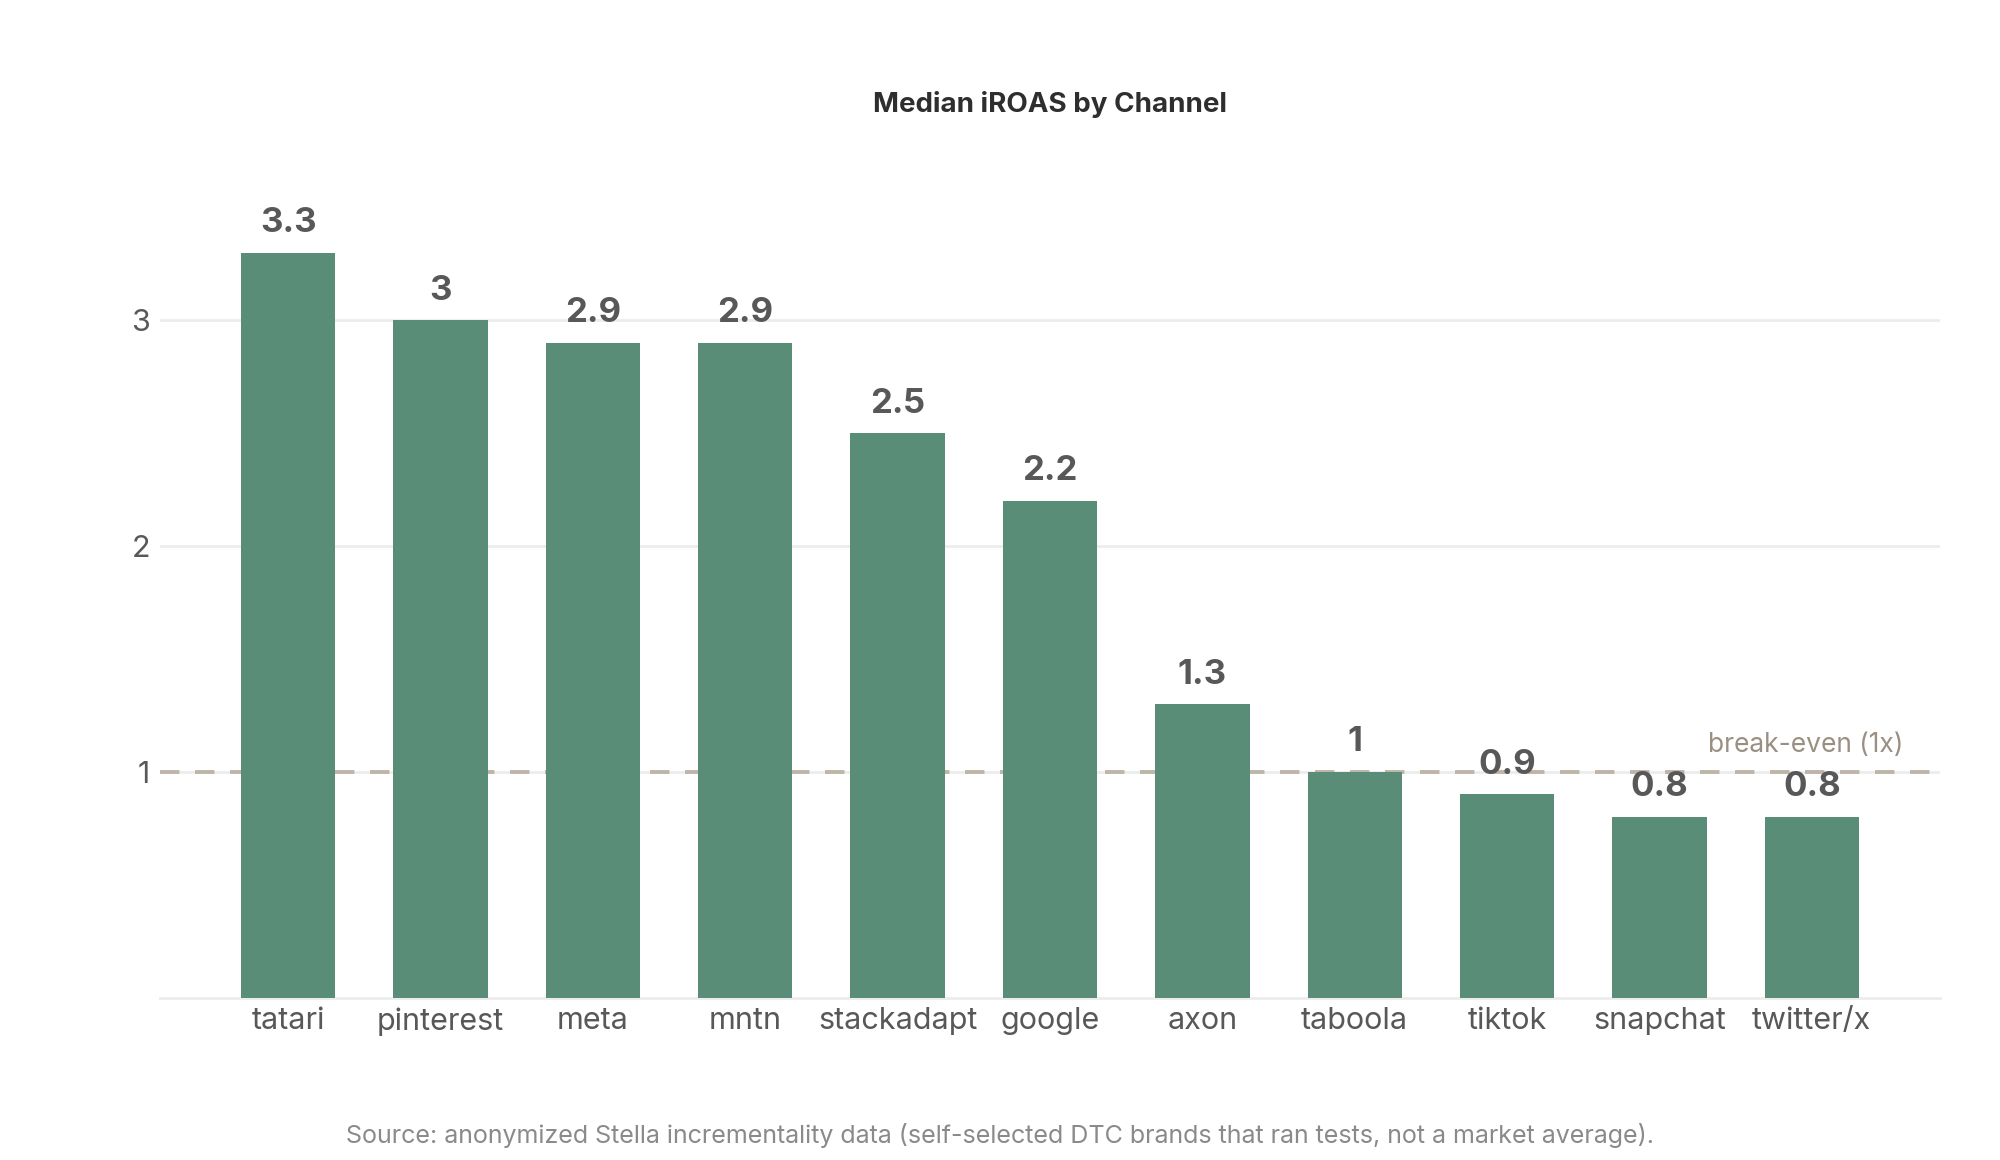
Across 225 DTC incrementality tests run on Stella, the median incremental ROAS was 2.31x, but broken out by channel it ran from under 1x on some platforms to over 3x on others. Same brands, same measurement, completely different returns depending on where the money went. These are medians from a self-selected sample that chose to test, not universal channel grades, so read thin channels with care. The point is the spread: one blended number should never be the last word.
Post-purchase surveys catch what pixels miss. Add one question to the order confirmation page: "How did you hear about us?" It captures self-reported discovery without a tracked click, so it picks up the podcast, the TikTok someone saw and never clicked, the CTV spot. Just be precise about what it measures: it doesn't say a channel caused 22% of sales; it says 22% of buyers associate it with finding you. That's a clue about demand your tracking is missing, not a revenue estimate, and it carries recall and order bias, so read it across enough orders to be stable, never one at a time.
Multi-touch attribution is your fast daily read. It splits credit across the tracked touchpoints, so its strength is speed and detail. Its weakness is that it can only credit what it can see, which skews toward trackable, lower-funnel clicks. Use it to steer bids and creative day to day, not to decide whether a channel deserves to exist.
How does the stack keep itself honest?
By making the methods disagree on purpose. They rest on different evidence and assumptions, so comparing them exposes failure modes any one of them would hide on its own. Agreement raises your confidence, disagreement tells you where to dig, and neither replaces actually identifying the effect.
Any single tool is internally consistent: it will hand you a confident, precise, wrong number every day. Confidence is not accuracy.
So you calibrate the fast, cheap methods against the slow, rigorous one. Run a holdout on a suspicious channel, and if the causal estimate lands well below what the platform claimed, it's over-credited in that window. Don't turn that into a permanent multiplier: a causal test is an anchor, valid for that spend, creative, audience, and season, not forever.
The layers also fine-tune each other over time. Every holdout you run calibrates your MMM, and the more it sees, the sharper its predictions get. Attribution and surveys flag where to test next, experiments answer, and the model keeps improving.
The honesty comes from one rule: never let the convenient method answer a question it wasn't built for.
How do you measure ad channels that resist tracking, like CTV and YouTube?
You measure them by their effect, not their clicks. Connected TV and much of YouTube are view-led and cross-device: the ad and the purchase happen on different screens, at different times, with another channel collecting the final click. Click- and user-level tracking has the least visibility into exactly the channels doing your upper-funnel work.
The problem is structural. A CTV ad plays on a screen with no link to click, in a household where one person watches and another buys, and the conversion shows up on a phone days later. US CTV ad spend is projected to approach $38 billion in 2026 (eMarketer), a big and growing budget line judged by a metric it was never built for.
YouTube has the same shape. Much of its value is view-through: someone watches, doesn't click, then returns later through a branded search or direct visit that last-click hands quietly to Google Search or "direct." The channel that created the demand gets none of the credit, and because budgets follow credit, that's how an incremental channel gets cut.
What works instead:
- Holdouts and media mix modeling. Run the channel in some regions and hold it out of matched ones, then compare sales. A geo experiment estimates lift without reconstructing any individual's path, which is why it works where pixels don't. MMM adds broader coverage from aggregate data. Google's own Conversion Lift is built on the holdout logic.
- Post-purchase surveys. Add the channel to your "how did you hear about us" options. When CTV or YouTube shows up at a rate your tracking never reported, those ads are creating discovery your behavioral data can't see.
- Read them together. If the survey shows YouTube driving discovery and a holdout confirms real lift, you can fund it with confidence, whatever last-click says.
Where should you start?
Start small, and start with your biggest blind spot. You don't need the whole stack on day one.
The survey is the cheapest win: one question, on by default, on every order. Within a few weeks, you'll have a directional read on the channels your analytics have been quietly losing.
Then pick the one paid channel where the stakes and the doubt are highest, usually a big upper-funnel line like Meta prospecting, CTV, or YouTube, and run a proper holdout. One clean causal read will change how much you trust every other number on your screen. As you scale, always-on incrementality and an experiment-calibrated MMM give you that causal layer continuously.
So put your best numbers up against something rigorous enough to contradict them. Then move budget on what survives.